
 ( click to enlarge )
Gilead Sciences, Inc. (NASDAQ:GILD) closed up today $1.26 or 1.76% to $72.86 and should continue higher tomorrow. The company reported earnings after the close and the market loved what they saw. The stock price is trading up after-hours and I expect it to gap open on Wednesday. I'm using the $78 level as next resistance.
 ( click to enlarge )
AVEO Pharmaceuticals, Inc. (NASDAQ:AVEO) chart is showing signs of a possible turn around. In terms of technical indicators, the RSI is starting to rise in the overols zone while the MACD is about to cross above its signal line. The trend is expected to begin the upwards movements.
 ( click to enlarge )
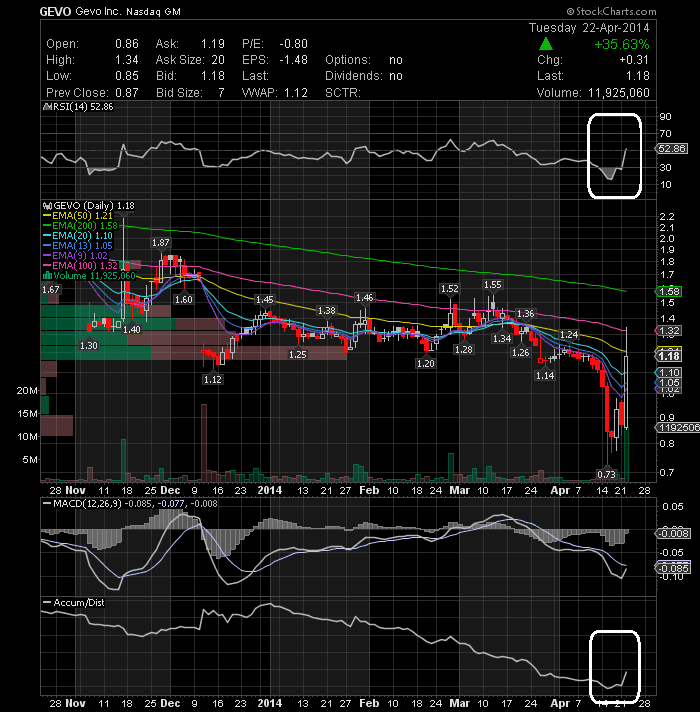
Gevo, Inc. (NASDAQ:GEVO) The stock today surged 35% or 31 cents to $1.18 per share at 10 times average volume of 1.05 million shares after the company has announced that it has come to an agreement with Lufthansa to evaluate Gevo's renewable jet fuel with the goal of approving Gevo's alcohol-to-jet fuel (ATJ) for commercial aviation use. After today's action the accumulation line started to turn up, which should eventually lead to price increases. The key resistance level to watch tomorrow is at $1.34.
 ( click to enlarge )
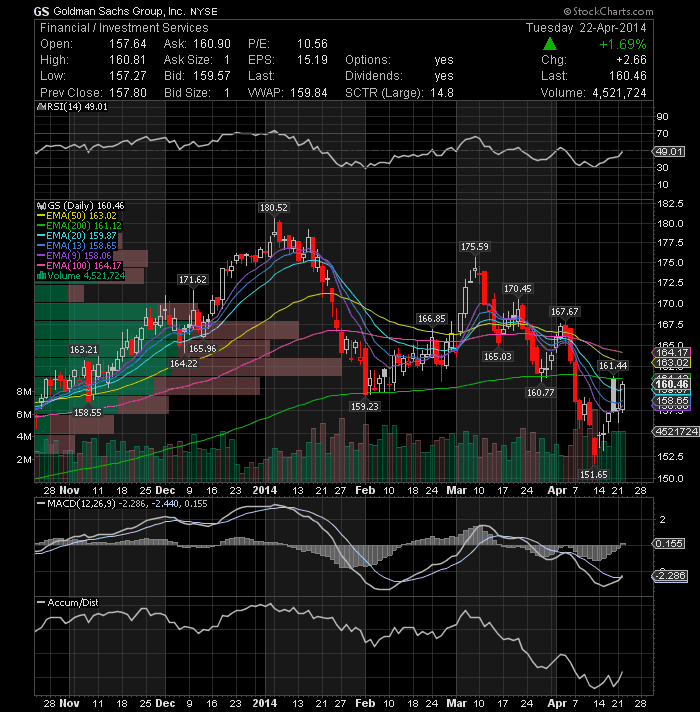
Goldman Sachs Group Inc (NYSE:GS) looks ready to break a recent high of $161.44 and its 200EMA. Technical indicators are looking positive with the RSI rising while the MACD is cutting above its signal line. Keep it on your watch list going forward.
 ( click to enlarge )
Celldex Therapeutics, Inc. (NASDAQ:CLDX) was on my bottom scan at $14.80 and hit a high of $16.16 today. A good example of why bottom plays can be very lucrative if you buy in at the right time ;)
 ( click to enlarge )
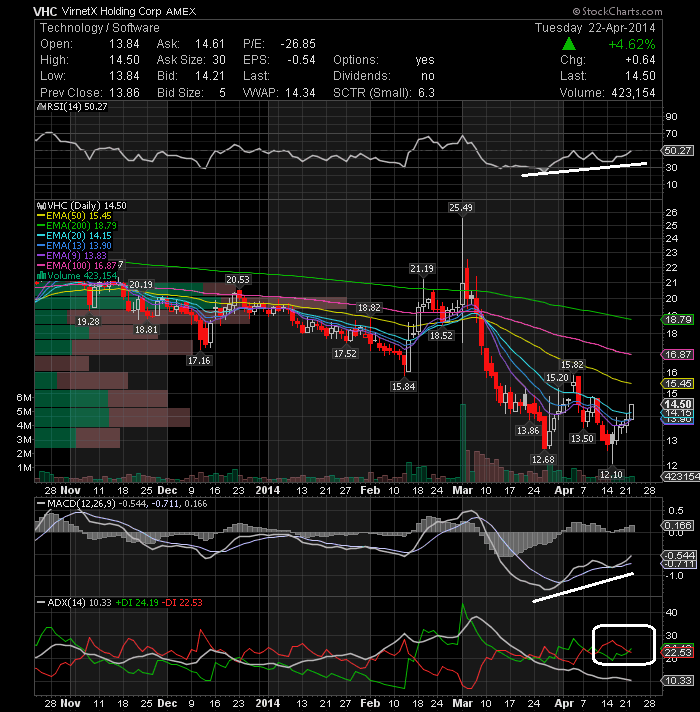
VirnetX Holding Corporation (NYSEMKT:VHC) is quietly gaining momentum. The stock surged in the final hour of trading closing at the highs of the day on solid volume. The real fireworks should begin if the stock can close above $15. The technical daily chart shows a bullish sign as the stock is back on top of 20-day moving average with MACD rising and approaching the zero line from below. For now, expect a run up to next resistance area around $15. If the stock is able to cross it and sustain above it, then it might go to $17.
 ( click to enlarge )
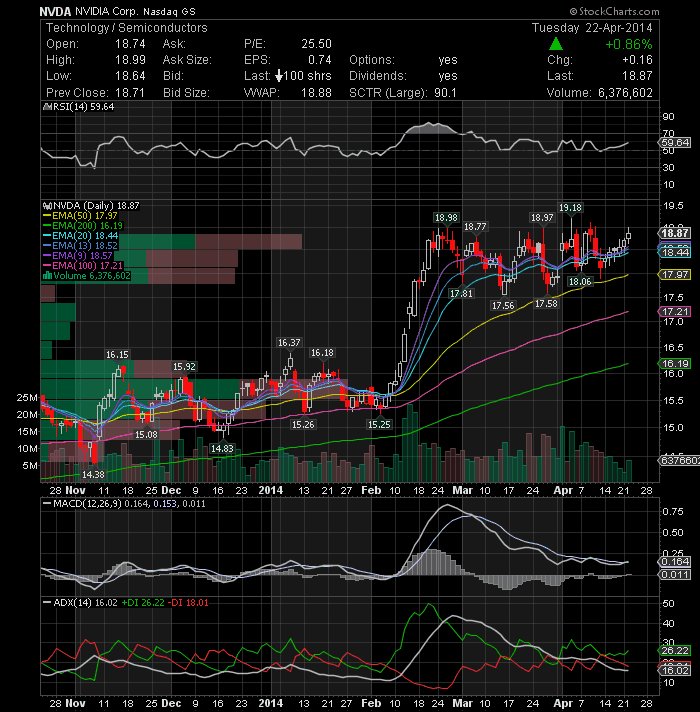
NVIDIA Corporation (NASDAQ:NVDA) is still trading sideways in the short-term. Its technical indicators are showing positive signal and its price bars are trading above the major EMA's. Waiting for a break above the 19.1 level for a long position.
During the day I tweet many times to my readers. I encourage everybody to subscribe AC Investor Blog twitter and newsletter, so you can receive my trade ideas and stock news in real time.
Disclaimer : This is not an investment advisory, and should not be used to make investment decisions. Information in AC Investor Blog is often opinionated and should be considered for information purposes only. No stock exchange anywhere has approved or disapproved of the information contained herein. There is no express or implied solicitation to buy or sell securities. The charts provided here are not meant for investment purposes and only serve as technical examples. Don't consider buying or selling any stock without conducting your own due diligence.
Thanks for visiting AC Investor Blog.
AC
