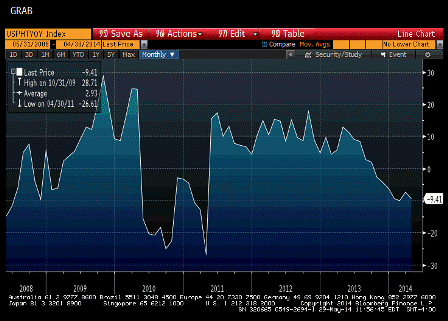
From the NAR: Pending Home Sales Edge Up in April
The Pending Home Sales Index, a forward-looking indicator based on contract signings, increased 0.4 percent to 97.8 in April from 97.4 in March, but is 9.2 percent below April 2013 when it was 107.7.
The PHSI in the Northeast increased 0.6 percent to 79.3 in April, but is 12.0 percent below a year ago. In the Midwest the index rose 5.0 percent to 99.2 in April, but is 6.9 percent below April 2013. Pending home sales in the South slipped 0.6 percent to an index of 111.9 in April, and are 6.4 percent below a year ago. The index in the West declined 2.9 percent in April to 88.4, and is 15.0 percent below April 2013.
Note: Contract signings usually lead sales by about 45 to 60 days, so this would usually be for closed sales in May and June.
pending home sales y/y
May 29, 2014 at 16:07 PM EDT
From the NAR: Pending Home Sales Edge Up in April The Pending Home Sales Index, a forward-looking indicator based on contract signings, increased 0.4 percent to 97.8 in April from 97.4 in March, but is 9.2 percent below April 2013 when it was 107.7. The PHSI in the Northeast increased 0.6 percent to 79.3 in [...]