
First of all, I would like to thank everyone who takes the time to visit AC Investor Blog. By the time you read this, I will be on vacation and will not be back until August 10th. Enjoy my blog and when I return I will have more trade Ideas to post.
 ( click to enlarge )
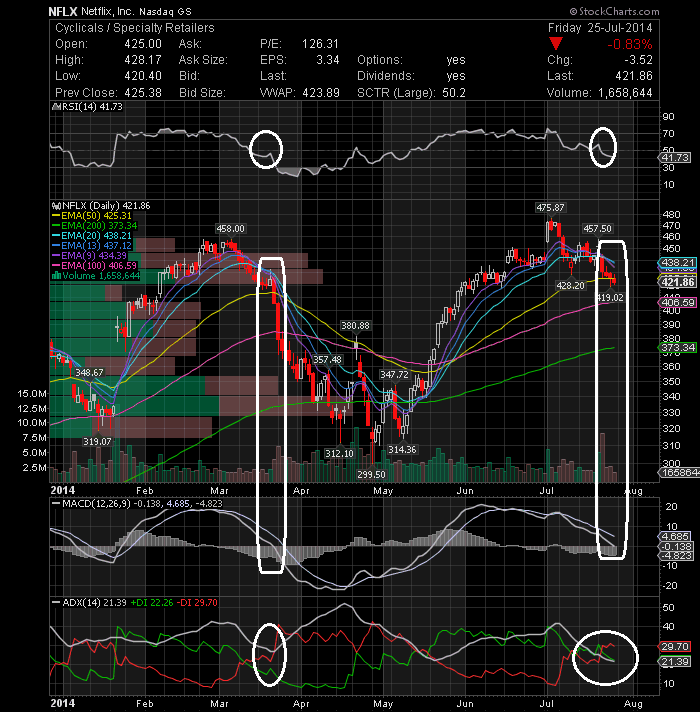
Netflix, Inc. (NASDAQ:NFLX) The stock closed lower for the week and below the 50-day EMA. The volumes on down days continue to be higher. The 20-day EMA is declining and the stock is well below it, so the medium-term bull market is under threat. Additionally, all technical indicators are looking bearish. The MACD indicator has entered the negative zone and the RSI has dropped to the oversold zone. If the history repeats itself, I believe a sell-off could happen again. Take a look at the coincidences of the chart.
 ( click to enlarge )
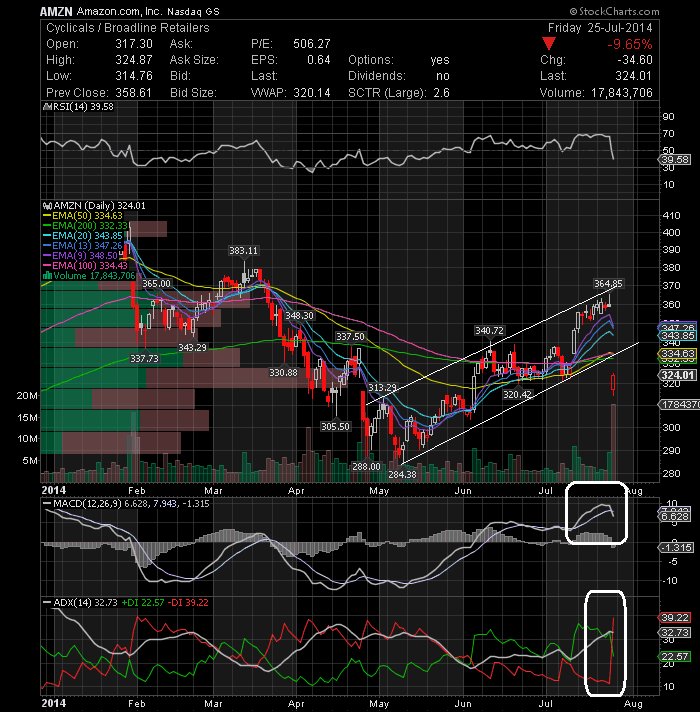
Amazon (NASDAQ:AMZN) declined sharply on Friday after the company issued Q2 earnings that missed analyst forecasts. From a technical standpoint, the rising channel has been broken to the downside on massive volume, suggesting the start of a new down phase. All indicators turned around quickly from bullish to bearish. Long positions should be avoided at this stage IMO.
 ( click to enlarge )
J C Penney Company Inc (NYSE:JCP) continued its bullish on Friday. The stock price is inching closer and closer to another breakout move. Buying momentum is still positive and strengthening. 9.43 is the level to watch for a breakout.
 ( click to enlarge )
Goldcorp Inc. (NYSE:GG) Strong Bullish engulfing bar Friday on decent volume. Worth keeping an eye on. Next resistance is now seen at 29.04 then 29.34. On watch.
 ( click to enlarge )
Symantec Corporation (NASDAQ:SYMC) has the perfect set up to make a nice run here. The break out point would be at 23.92.
During the day I tweet many times to my readers. I encourage everybody to subscribe AC Investor Blog twitter and newsletter, so you can receive my trade ideas and stock news in real time.
Disclaimer : This is not an investment advisory, and should not be used to make investment decisions. Information in AC Investor Blog is often opinionated and should be considered for information purposes only. No stock exchange anywhere has approved or disapproved of the information contained herein. There is no express or implied solicitation to buy or sell securities. The charts provided here are not meant for investment purposes and only serve as technical examples. Don't consider buying or selling any stock without conducting your own due diligence.
Thanks for visiting AC Investor Blog.
AC
