
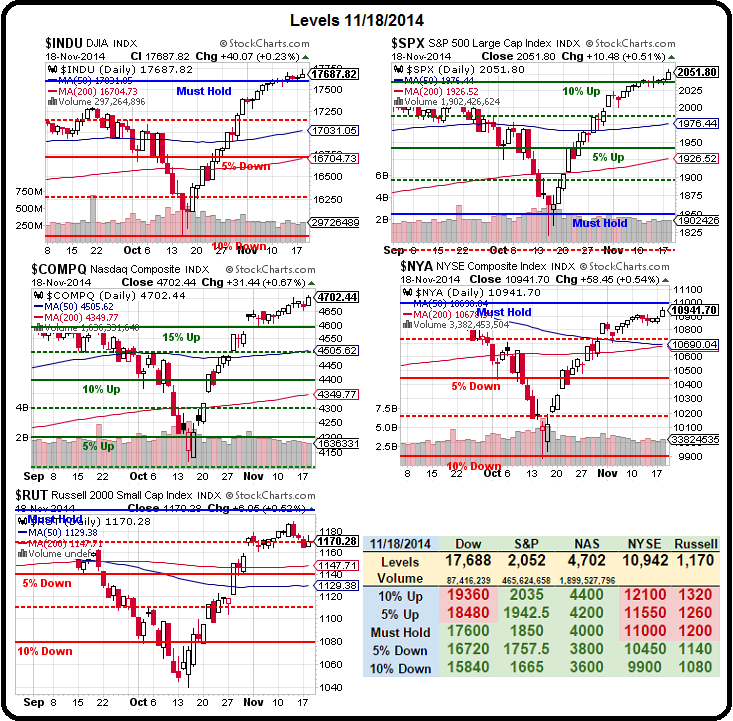
 S&P 2,050!
Why not? Why not 3,000? 3,500? 4,000? Is there any number that will begin to sound ridiculous to top 1% traders, who are using the Fed's Free Money to make even more money for themselves? It's like the $50M balloon dog at Christies – what's the difference to people who have, essentially, infinite amounts of money to spend?
The Forbes 400, for example, made $1Tn MORE between 2009 and 2012 – an average of $300Bn a year. Last year, they added on another $400Bn bringing their total INCOME up to an average of $1,000,000,000 PER YEAR per Billionaire. Compared to the average household income of the average US Citizen of $52,000, that is, pretty much, INFINITELY more (19,230 times more, to be exact).
Meanwhile, over the same period of rampant QE, the average income of the Median Household FELL 4%, from $54,000 to $52,000.

Of course, that should be obvious, as it takes $2,000 from 150M working people just to come up with $300Bn of the $400Bn the top 400 made last year. That's how it works, folks – they take $2,000 from 150M people and the rich get richer and the poor (or the middle class) get poorer.
 Yes, there is also some economic expansion – there has to be or where did the other $100Bn come from? No wonder record amounts of money (a mere $2Bn) were spent on the recent mid-term elections – in order to guarantee the top 1% that they'd get at least 2 more years of the same treatment.
And what do the top 0.0001% do with their money? Over $1Bn more pours in every day – they can't possibly spend it all on balloon dogs and $5,000 hamburgers – they HAVE to invest some of it!
IN PROGRESS
