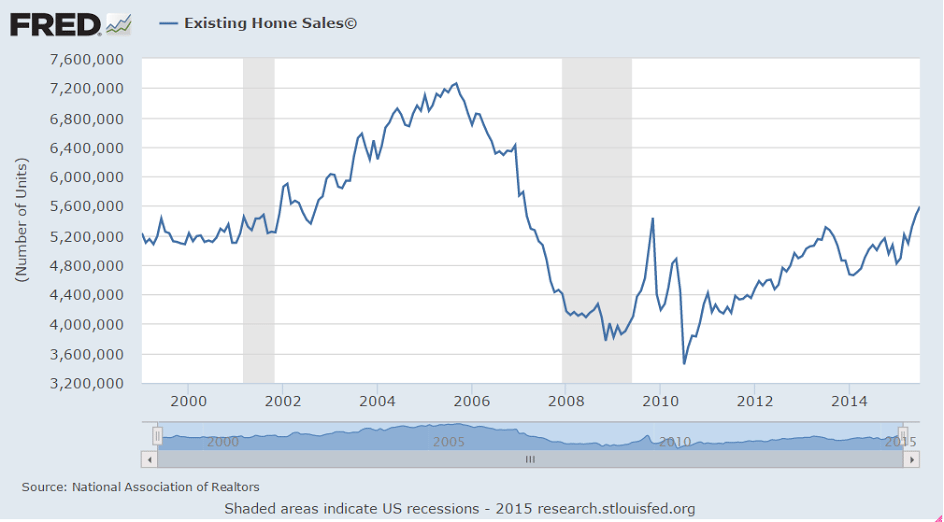
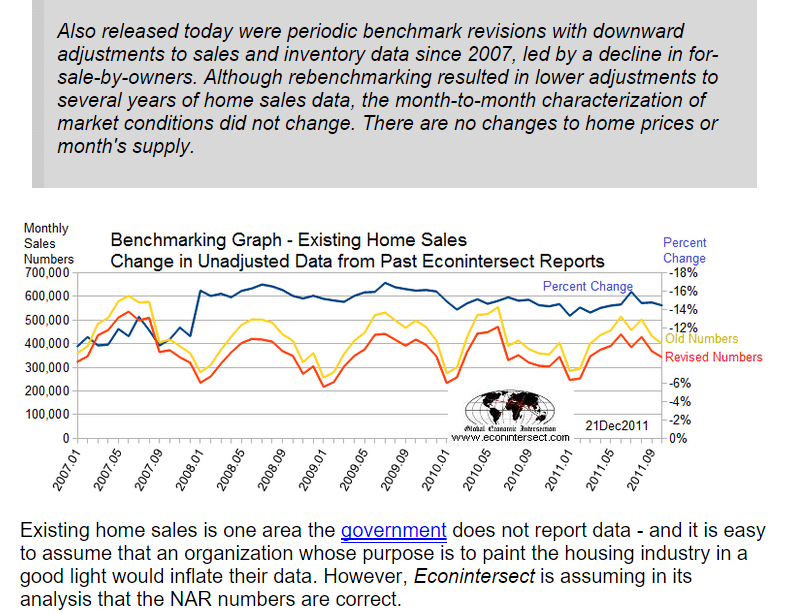
More existing home are turning over, however look at the downward revisions in the last chart. And while prices may be up, they still haven’t reached replacement value as evidenced by the lack of new construction and most recently the sharp decline in permits after the run up in front of NY’s tax break that expired June 15. It is also likely some buying has been accelerated out of fear of rates going higher:
Existing Home Sales
Highlights
There’s plenty of life in the housing sector with existing home sales up a stronger-than-expected 2.0 percent in July to a 5.59 million annual rate. And demand is well ahead of supply which is very thin, at 4.8 months at the current sales rate vs 4.9 and 5.1 in the two prior months and 5.6 months in July last year. Sales are up 10.3 percent year-on-year, well ahead of the median price which, at $234,000, is up 5.6 percent. This mismatch, especially with thin supply, hints at pricing power ahead.
Single-family homes lead the report, up 2.7 percent in the month at a 4.960 million annual rate. Condos, where demand on the new home side is soaring, actually fell 3.1 percent in the month to a 630,000 rate. Year-on-year, sales of single-family homes are up 11.0 percent with condos at plus 5.0 percent.
By region, July’s strength is centered in the South with a gain of 4.1 percent. The West follows at plus 3.2 percent with the Midwest unchanged and the Northeast down 2.8 percent. Year-on-year, sales are very evenly balanced with all right at the 10 percent mark.
The balance of this report is impressive, pointing to a rising tide of strength across housing which, given spotty performances by the factory and consumer sectors, looks to be the leading driver for the second-half economy.

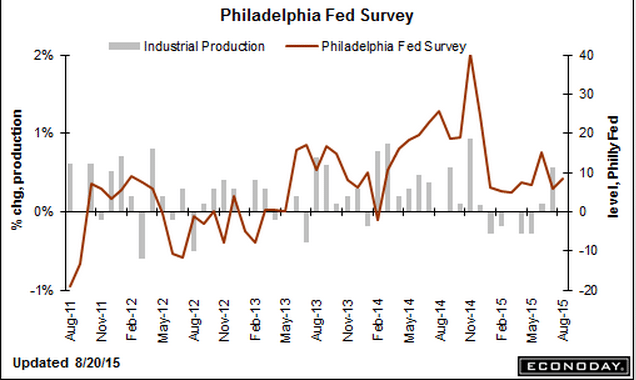
Philadelphia Fed survey remains low:
Philadelphia Fed Business Outlook Survey![]()
Highlights
That sigh you hear is one of relief, that Monday’s historic plunge in the Empire State report is probably a fluke. The Philly Fed’s index, which is very closely watched, posted a gain for August and not a huge plunge. The general business conditions index came in at a stronger-than-expected 8.3 vs July’s 5.7. Shipments lead the report at a very strong plus 16.7. Order data show less strength, with new orders at 5.8 in August vs 7.1 in July and with unfilled orders showing a slight month-to-month decline at minus 1.0. A positive in the report is a respectable monthly gain for employment to 5.3 vs July’s contraction of minus 0.4. The 6-month outlook is also a plus, up 1.6 points to a solid 43.1. The early view on the August factory is thankfully mixed. Watch tomorrow for the manufacturing PMI flash.
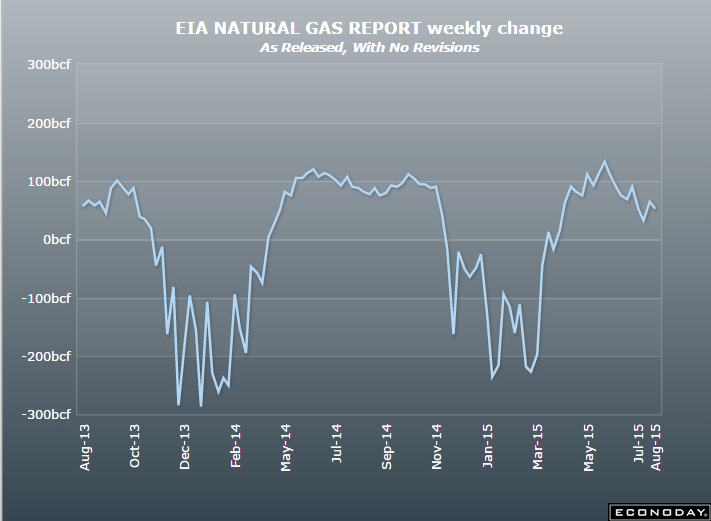
The natural gas inventory build was less than expected, perhaps indicating a fall off in production as maybe 30% of new gas production was a by product of shale oil production, which has begun to fall off after the drilling rigs in service fell off over 50% due to price declines.
The post Existing home sales, Philadelphia Fed survey, Nat gas appeared first on The Center of the Universe.